Background
最近年终述职,需要画不少图。每张图需要用鼠标调整各元素位置、调整不同元素间的线··· 总之大量的鼠标操作使得画图耗费了不少时间。
经过调研发现了 graphviz 这个工具,能以类似于程序代码的一段文本来生成图片。生成图片的元素样式、线条样式、整体布局等属性,均可调整。
即我们只需要定义好元素、线条、布局样式等参数,画图的过程交给电脑,就能生成图片。举个例子:
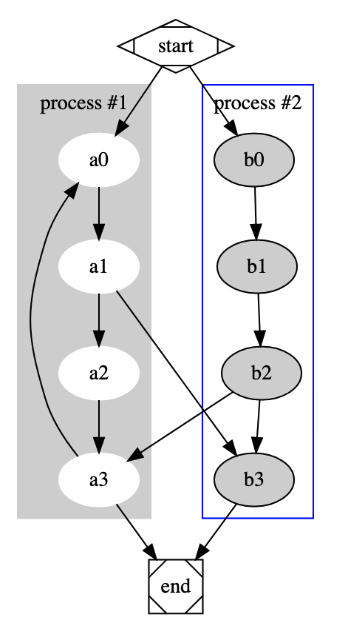
这样一张图(有方框、多颜色的元素以及特殊形状的开始结束节点),我自己画起来至少 3 分钟,并且后续改动也费时。比如要加个节点 a4,a4 和 a3、a1、b2 都要连起来,不仅要新增节点和连线,可能还要调整原有节点的位置,以保证整体看起来好看。
但是用几行代码,不到 1 分钟,就能生成这张图:
 1
 2
 3
 4
 5
 6
 7
 8
 9
10
11
12
13
14
15
16
17
18
19
20
21
22
23
24
25
26
27
|
digraph G {
  subgraph cluster_0 {
    style=filled;
    color=lightgrey;
    node [style=filled,color=white];
    a0 -> a1 -> a2 -> a3;
    label = "process #1";
  }

  subgraph cluster_1 {
    node [style=filled];
    b0 -> b1 -> b2 -> b3;
    label = "process #2";
    color=blue
  }

  start -> a0;
  start -> b0;
  a1 -> b3;
  b2 -> a3;
  a3 -> a0;
  a3 -> end;
  b3 -> end;

  start [shape=Mdiamond];
  end [shape=Msquare];
}
|
总之,画这种标准化矢量图形,用 graphviz 是挺省时省力的。
Introducation
graphviz 是一组工具包,它们均使用 dot 语言来描述图形。该工具包包含有如下工具:
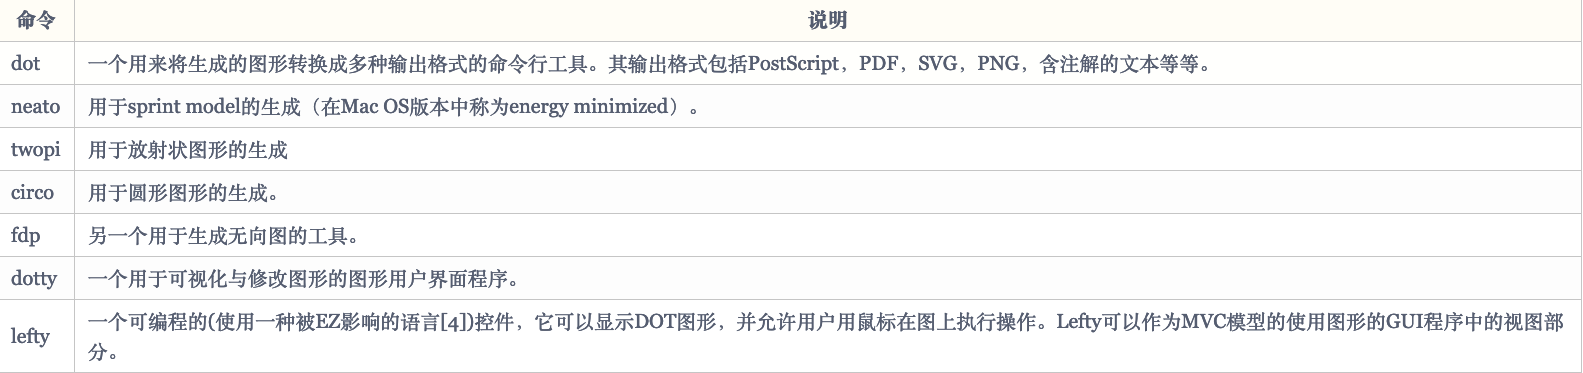
这些工具都使用 dot 语言,只是渲染出的图形样式各不相同。
本文接下来介绍 dot 语言的用法。
The Dot Grammer
dot 语言中,主要有如下几个概念
Graph
图,表示一块区域。主要分为 3 类:
- digraph,定义有向图
- graph,定义无向图
- subgraph 子图,表示一块图片区域
其中,每个 dot 文件必须定义一个 digraph 或 graph。
而 subgraph 无数量限制,其主要有三个作用:
- 用于表示图的结构,指明一些
node 或者 edge 是组成在一起的
- 能提供一个上下文,用于批量设置属性
- 对于名称为 cluster 开头的
subgraph,部分引擎会将该 subgroup 用矩形框选并凸显出来。
图的常用属性有
| 属性名 |
默认值 |
说明 |
| label |
|
图片标签 |
| bgcolor |
|
背景颜色 |
| fontcolor |
black |
字体颜色,定义上面示例的颜色 |
| fontsize |
14 |
字体大小 |
| rankdir |
TB |
排序方向,LR(left to right) or TB(top to bottom) |
用法示例
1
2
3
4
5
|
digraph G {
    label="graph"
    bgcolor=blue
    fontsize=16
}
|
其中 digraph 可替换成 graph、subgraph。G 为图的名称,可为空。
Node
node 表示一个节点,表示方法为 节点ID [节点属性] ,例如
1
2
3
4
5
|
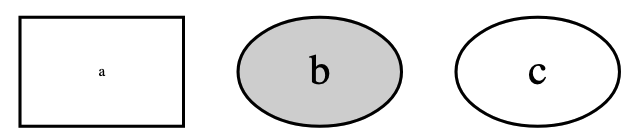
digraph G {
    a[fontsize=5,shape=box]
    b[style=filled]
    c
}
|
输出的图形如下
node 的常用属性就不赘述了,详见 官方文档-Node
Edge
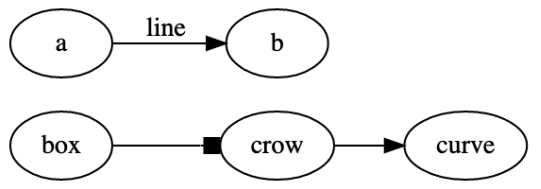
edge 即连接 node 之间的连线。
具体属性看文档即可。因为比较简单,这里仅举个例子而不具体说明
1
2
3
4
5
6
7
|
digraph demo {
    rankdir=LR

    "box"->"crow"[arrowhead=box]
    "crow"->"curve"[arrowhead=normal]
    "a"->"b"[label="line"]
}
|
Record-based Nodes
这是一种特殊样式的节点。即单个 node 中包含多个部分,且 edge 能指向单个 node 中不同的部分,见图
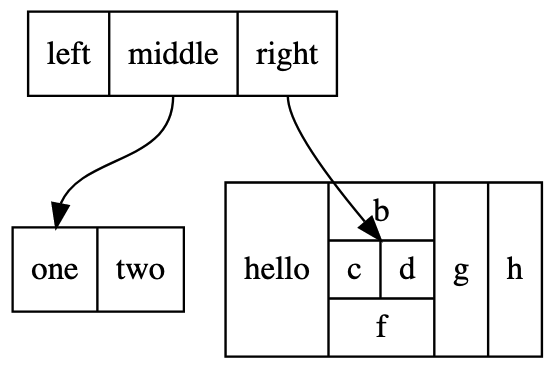
可以看到,一个节点可分为多个部分,不同部分有不同的锚点,可连上不同的线。
1
2
3
4
5
6
7
8
9
|
digraph G {
    node [shape=record]

    struct1 [label="<f0> left|<f1> middle|<f2> right"]
    struct2 [label="<f0> one|<f1> two"]
    struct3 [label="hello|{ b |{c|<here> d}| f}| g | h"]
    struct1:f1 -> struct2:f0
    struct1:f2 -> struct3:here
}
|
其中 node 的不同部分,用 | 分隔。例如 <f0> left|<f1> middle|<f2> right 表明有 left、middle、right 三个部分。
而 < > 部分框住的,是锚点的名称,使用它能将 edge 连接到该部分上。
struct1:f2 -> struct3:here 表示一条 edge,是从 struct1 节点的 f2 锚点到 struct3 节点的 here 锚点
注意,这里一定要指定节点类型为 record,即声明 node [shape=record],否则不能正确展示这种包含多个部分的节点。
Example
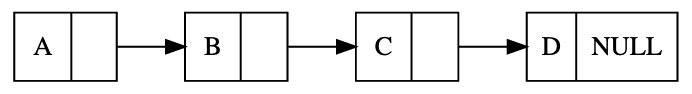
Linklist
 1
 2
 3
 4
 5
 6
 7
 8
 9
10
11
12
13
|
digraph G {
    rankdir = LR
    node[shape = record]

    a[label = "{A|}"]
    b[label = "{B|}"]
    c[label = "{C|}"]
    d[label = "{D|NULL}"]

    a -> b:w;
    b -> c:w;
    c -> d:w;
}
|
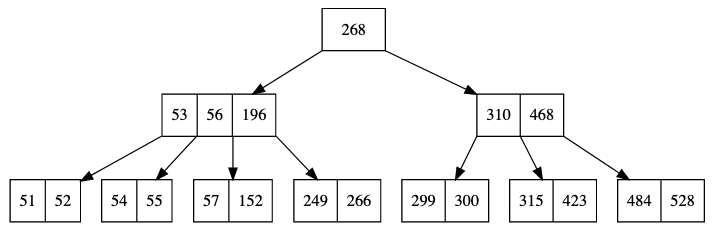
B-Tree
 1
 2
 3
 4
 5
 6
 7
 8
 9
10
11
12
13
14
15
16
17
18
19
20
21
22
23
24
|
digraph {
    splines=false
    node [shape=record]

    node0x10055a2e0 [label = " <node268> 268"]
    node0x10055a2e0:<node268>:sw -> node0x10055a060
    node0x10055a060 [label = " <node53> 53| <node56> 56| <node196> 196"]
    node0x10055a060:<node53>:sw -> node0x100559a80
    node0x100559a80 [label = " <node51> 51| <node52> 52"]
    node0x10055a060:<node53>:se -> node0x10055a310
    node0x10055a310 [label = " <node54> 54| <node55> 55"]
    node0x10055a060:<node56>:se -> node0x10055a240
    node0x10055a240 [label = " <node57> 57| <node152> 152"]
    node0x10055a060:<node196>:se -> node0x100559b10
    node0x100559b10 [label = " <node249> 249| <node266> 266"]
    node0x10055a2e0:<node268>:se -> node0x10055a290
    node0x10055a290 [label = " <node310> 310| <node468> 468"]
    node0x10055a290:<node310>:sw -> node0x10055a0b0
    node0x10055a0b0 [label = " <node299> 299| <node300> 300"]
    node0x10055a290:<node310>:se -> node0x10055a1b0
    node0x10055a1b0 [label = " <node315> 315| <node423> 423"]
    node0x10055a290:<node468>:se -> node0x10055a160
    node0x10055a160 [label = " <node484> 484| <node528> 528"]
}
|
Reference
https://itopic.org/graphviz.html
https://graphviz.org/doc/info/lang.html
https://zhuanlan.zhihu.com/p/194274635
https://fivecakes.com/p/5ef55d9ca02ad90d27610e17
 times read